Validation
Verified on 2026-09-10 using Python 3.10 on macOS ARM64, CPU, in a fresh isolated environment. No biological training was run.
The archived numerical results below used the earlier kernel-map default. They are not validation results for the new automatic FiLM default. Use map_type="kernel" when reproducing those runs. The automatic-map regression checks are in tests/test_maps.py, including stage exclusion, paired validation, quality warnings, frozen-map input gradients, normalization, user-provided maps and exact save/reload predictions.
On 2026-09-20, the default FiLM and time-independent MLP workflows were each run for 300 map epochs and 200 trajectory iterations on the paired toy with its middle stage omitted. Both completed without map-quality warnings and reproduced their primary and secondary predictions exactly after reload. The paired tutorial notebook was also executed with automatic FiLM fitting. These are CPU functional checks, not evidence of accuracy at held-out biological stages. The five original-engine equivalence checks were rerun with explicit kernel mapping and retained zero parameter differences.
The unbalanced synchronized secondary-energy correction dated 2026-10-31 is validated separately below. Earlier unbalanced multimodal model outputs were not retrained after that correction and remain historical workflow demonstrations.
Biological temporal holdout
On 2026-10-12, the pancreas reconstruction tutorial was executed on paired RNA PCA50 / ATAC PoissonVI22 inputs. E15.5 (t = 1) was excluded from both FiLM-map and vector-field fitting; E14.5 and E16.5 kept their original times 0 and 2. The vector-field checkpoint records exactly 1,000 iterations, and RNA/ATAC predictions agreed after save/reload. The map passed its within-retained-stage validation checks; this does not establish unseen-stage map accuracy.
The notebook includes shared UMAPs fitted only on retained observations and
representation-space distribution scores. Mean Sinkhorn reconstruction scores
were 0.3796 for RNA and 0.4914 for ATAC, versus 0.6399 and 0.7794 for the initial
distributions. The equal endpoint-mixture baseline scored 0.3904 and 0.4573,
so the short run did not beat that baseline in both modalities. These are one-seed
results with five subsampling repeats, not convergence or biological-superiority claims.
The existing all-data reduced representations and scalar normalization were fixed;
this is not an end-to-end raw-data holdout. The resolved settings and input hashes
are recorded in provenance/heldout_pancreas_1000.json.
The optional W2 scalar-normalization branch was also executed for 1,000
vector-field iterations, including checkpoint reload and shared UMAP projection.
Its RNA and ATAC scales were fitted only at times 0 and 2. Changing all held-out
values by a factor of 100 left both fitted scales unchanged, and converting the
working inputs back to their selected input units reproduced the source features.
The default branch retained identical reconstruction scores. Details are recorded
in provenance/heldout_normalization_validation.json.
Original-engine equivalence
Same data, float32 precision, settings and seed in the original and packaged engines. The original device selector is overridden to CPU only in the comparison harness; its source files remain untouched.
Mode |
Iterations |
Maximum parameter difference |
|---|---|---|
Balanced |
4 |
0 |
Kernel synchronization |
4 |
0 |
Unbalanced |
4 |
0 |
Adaptive lambda |
4 |
0 |
Synchronized, including gradient diagnostic |
100 |
0 |
The 100-step reference uses an enabled secondary density term, where the original diagnostic is defined. A separate regression check covers a disabled density term, which crashes the original diagnostic and is handled in the COATI copy. These checks establish equality for the tested cases, not every possible backend or experimental option.
200-step CPU toy runs
All use seed 0 and 128 initial cells. Endpoint Sinkhorn uses the original per-time median blur, evaluated on all endpoint samples. The floor was estimated with smaller training batches; it is context rather than an exact full-sample threshold.
Example |
Before transport |
After transport |
Kinetic energy |
|---|---|---|---|
gaussian |
0.147707 |
0.000455 |
0.139834 |
split |
0.146521 |
0.003423 |
0.153955 |
paired |
0.147707 |
0.000166 |
0.148672 |
unbalanced |
0.146521 |
0.003776 |
0.001169 |
These arrays were not W2-normalized: kinetic energy need not be near one. Unbalanced energy is stored per particle with mass weights; the reported mean is not the total action. Its predicted total mass ratio is 0.9676, versus an observed ratio of 2.0. The short run verifies execution and geometric transport but has not converged in mass. Endpoint Sinkhorn is unweighted and should not be interpreted as a mass-aware unbalanced score.
Interfaces and tutorials
12 regression checks passed: adapters, invalid input rejection, save/reload, normalization, secondary projection, accurate kernel and the 100-step disabled-loss diagnostic.
All four notebooks executed cell by cell, including 200-step training and exact prediction reload checks.
The Sphinx site builds with warnings treated as errors.
Core source hashes and both original repositories’ starting status are rechecked for preservation.
Machine-readable records are in provenance/: equivalence.json, toy_metrics.json, notebook_execution.json, and the tested package list. scripts/verify_equivalence.py reruns the read-only original comparison when a TraInf checkout is available.
Scope
CPU results only. GPU/MPS, long biological training runs, full flow-matching pipelines and downstream molecular analyses have not been validated here. The toy checks and short biological holdout establish execution for these examples, not biological superiority.
AnnData conventions and UMAP growth
On 2026-10-12, all 47 package checks passed after adding input preparation and
UMAP dynamics functions. Direct AnnData and TemporalData training produced
identical model parameters for the tested single- and multimodal unbalanced
examples. Analytic growth checks matched the saved ODE derivative, including its
alpha_growth multiplier. Tests covered metadata ambiguities, array conversion,
categorical time mappings, paired features, reordered cells, colors and labels,
copy-based storage and h5ad reload.
The unbalanced script ran for 300 iterations; the balanced script ran for 200.
Both produced a fitted UMAP, figure and stored vectors, with exact numerical
save/reload checks. The new dynamics notebook executed all six code cells.
Balanced results did not fabricate growth values. This validates the interfaces
and plotting behavior, not converged population mass or biological accuracy.
Records are in provenance/anndata_dynamics_validation.json. The training
algorithm under src/coati/_core/ was not changed.
Gastrulation UMAP dynamics
On 2026-10-12, the biological dynamics tutorial was run on all 35,503 paired gastrulation cells (RNA50 / ATAC14) at times 0, 1, 2 and 2.5. The multimodal unbalanced checkpoint records exactly 1,000 vector-field iterations. The fitted FiLM map passed its configured within-stage validation checks, with checkpoint selection at epoch 53; these checks reuse validation cells for selection and do not establish independent biological accuracy.
The figure displays all 11,470 E8.5 cells using the existing source RNA UMAP.
Source annotations are preserved, with 3,015 missing labels explicitly marked
unknown across the training data. Features are reused as supplied without a
second normalization. No new UMAP or cell-type inference is performed.
Velocities and instantaneous growth agree exactly after checkpoint reload;
AnnData storage preserves the tested vectors, growth, coordinates and barcodes.
The standalone script was verified by reloading the same run, and notebook
plotting/storage cells were also checked from the notebook directory.
This one-seed short run is a functional biological-data example, not a claim of
convergence, lineage accuracy or measured proliferation. The resolved configuration,
source hashes, map diagnostics and growth summaries are in
provenance/gastrulation_dynamics_1000.json. No training algorithm or original
TraInf file was changed.
Standalone gastrulation map quality
On 2026-10-12, the map-only tutorial trained the
existing FiLM mapper on paired RNA50 / ATAC14 gastrulation features. An outer
within-stage split reserved 7,101 test pairs before calling train_map. The map’s
saved internal splits contain 22,722 optimization and 5,680 validation pairs;
these three roles are disjoint. The map completed 79 epochs of a 300-epoch budget,
selected epoch 49, and passed its configured internal validation diagnostics.
No vector-field training was run for this tutorial.
The source RNA UMAP is a visualization with fixed source preprocessing. The ATAC UMAP and both 15-neighbor classifiers were fitted only on real optimization ATAC. True and mapped test ATAC use the same frozen UMAP transform. Labels and stage agreement were scored in ATAC14, not UMAP. The 6,516 annotated test cells exclude unknown labels from cell-type scores; all test pairs remain in stage checks.
Test input |
Celltype agreement |
Macro recall |
Stage agreement |
|---|---|---|---|
Real ATAC |
82.27% |
66.17% |
76.59% |
T-mapped ATAC |
83.81% |
67.42% |
80.23% |
These one-seed readouts assess preservation under a fixed reference classifier, not biological superiority of predictions over observations. FiLM receives time, so stage agreement is conditional on supplied time, not independent time inference. Mapped cell-type agreement at E7.5 was 67.61%; per-type counts and recalls identify weaker groups. Precomputed source PCA/LSI and scales were not refitted, and this is not a new-stage or raw-data preprocessing holdout.
Map outputs agreed exactly after reload. The notebook’s analysis cells were also
verified from its own directory, and the standalone script reproduced the saved
map checks using --reuse. Numerical settings, data hashes, subgroup tables and
validation details are in provenance/gastrulation_map_quality.json. Original
TraInf files and the packaged training algorithm were not changed.
Lineage molecular readouts
On 2026-10-12, all 56 package checks passed after adding downstream feature readouts and explicit later-start inference. Tests cover dense/CSR/CSC feature extraction, cell/variable reordering, exact and duplicate neighbor matches, binary probabilities, support masking, stable growth weighting, missing-lineage rejection, fixed-baseline validation and unchanged default integration results. The original training engine was not modified.
The lineage tutorial executed on 237 E8.0 NMP starting cells, integrating to E8.75 with the existing 1,000-step gastrulation checkpoint. No path passed the Somitic endpoint threshold and support screen. The tutorial reports no NMP-to-Somitic molecular curves for that checkpoint; additional plots are explicitly NMP-origin diagnostics. Their observed markers represent different annotation cohorts, not longitudinal measurements.
Three genes and three promoter-candidate peaks were extracted from source H5AD files in bounded blocks with verified barcode order. Local decoders withheld 7,101 cells from fitting. Gene skill versus a fixed training-mean baseline was 0.660 (T), 0.320 (Sox2) and 0.337 (Tbx6). Peak Brier skill was -0.020, 0.227 and -0.005 for the displayed features: two peaks did not improve the constant open fraction baseline. Source PCA/LSI and scales remained fixed, so this is a decoder holdout, not an end-to-end preprocessing or vector-field holdout.
The notebook also ran from its own directory; the standalone script reproduced
its endpoint screening and feature readout results. Machine-readable settings,
scope and readout values are in provenance/lineage_feature_validation.json.
These checks validate software behavior, not a recovered Somitic lineage,
regulation or chromatin priming.
Cell-type mass accounting
The updated gastrulation dynamics tutorial reuses its original 1,000-iteration model and tracks all 9,018 E7.5 particles through E8.0 to E8.5. With stage-matched one-neighbor RNA50 labels and globally normalized endpoint mass, NMP contributions are +6.688522 incoming, -0.265143 outgoing and -0.297578 retained reweighting percentage points. Their sum, +6.125801, equals the predicted proportion difference; the cross-sectional observed difference is displayed separately. These values illustrate the fitted model’s relative-mass accounting, not independent biological transition estimates or a claim of convergence.
Tests check the exact identity on retained, entering, leaving and unrelated particles, normalization over the full population, stability under large log mass offsets, balanced weights, explicit stage/time mapping, missing predicted types, reference row order, invalid intervals/weight axes and plot signs.
Mass-weighted secondary kinetic energy
On 2026-10-31, eight targeted regression cases checked the real ODE/loss pipeline against known particle actions: increasing, decreasing and constant mass; initial total mass different from one; agreement with balanced energy at uniform constant mass; gradients through growth and initial log mass; particle-specific motion and actual solver step lengths; time-dependent mapping; and mass carried between successive observed intervals. Balanced energy keeps the original code path. See the migration note for the formula and the distinction from earlier unbalanced synchronized training.
The complete suite passed 74 tests. A separate 100-iteration multimodal, unbalanced Gaussian-bump run completed with finite model parameters, trajectories and log masses, and predictions agreed exactly after reload. This is a functional training check, not a convergence or accuracy claim.
Fresh Gaussian map and synchronized transport
The Gaussian-bump examples under Synthetic data reuse committed, reproducible AnnData and a frozen map generated by the repository build script. The initial covariance is 0.004 I2 and both terminal covariances are 0.003 I2. AnnData stores the 3000 observed cells and a separate 10000-pair map-fitting pool. Both balanced and unbalanced experiments therefore use identical observations and T.
T uses the original FourierBumpMLP architecture and weighted supervised objective: 6000 AdamW steps, batch 768, learning rate 1e-3, z weight 12, and an 85/15 seeded split. State selection uses validation loss; the selected step is 1500.
Evaluation |
Pairs |
XY RMSE |
z RMSE |
z MAE |
|---|---|---|---|---|
Held-out observed |
434 |
0.000047 |
0.021079 |
0.004067 |
Held-out support |
1066 |
0.000065 |
0.005544 |
0.003500 |
Independent grid |
9216 |
0.000067 |
0.005036 |
0.002998 |
The independent-grid height correlation is 0.999378. The predicted height at (0.5, 0.5) is 0.999919, with target 1. Observed pairs have zero target height; support and grid targets follow the bump surface, so their errors are reported separately. The grid does not enter fitting or state selection.
The two balanced fields use the concise public Config interface. The tutorial overrides only 3000 steps per model, batch 256, hidden width 256, adaptive Sinkhorn penalties and Cy=0.5; two hidden layers, LeakyReLU, learning rate 1e-3, dt 0.1 and the remaining loss settings use COATI defaults. Both start from the same fresh random initialization. There is no warm-up. The synchronized field uses the frozen T; support points are not trajectory snapshots.
Model |
Endpoint Sinkhorn |
Primary kinetic energy |
Secondary kinetic energy |
Median maximum mapped height |
|---|---|---|---|---|
Without sync |
0.000206 |
0.161313 |
0.999115 |
0.380628 |
With sync |
0.001425 |
0.213448 |
0.266299 |
0.038393 |
The balanced Cy sweep uses that same no-sync baseline and the same 3000-step budget and initialization for every synchronized run. It reports the fitted models directly under the fixed optimization budget.
Cy |
Endpoint Sinkhorn |
Secondary kinetic energy |
Median maximum mapped height |
|---|---|---|---|
0.1 |
0.000120 |
0.374621 |
0.093191 |
0.5 |
0.001425 |
0.266299 |
0.038393 |
0.7 |
0.000807 |
0.232102 |
0.029090 |
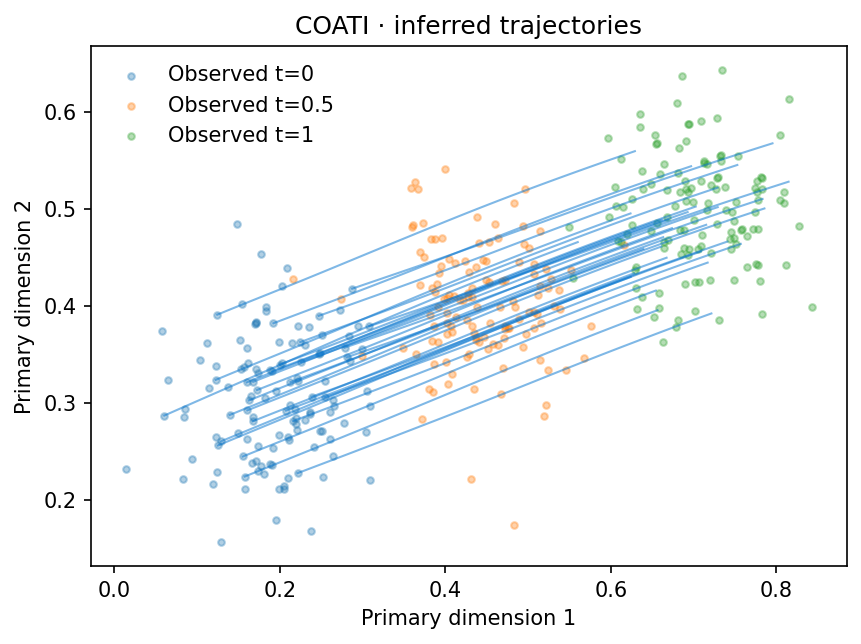
All 1000 initial particles are plotted without path selection or smoothing.
Balanced target and predicted mass are one, despite the larger sampled terminal
snapshot. The unbalanced tutorial sets biological_num=[1, 2], mass coefficient
100 and global mass matching. At beta=1, its predicted terminal masses are 1.980399
without sync and 1.981807 with sync. At beta=0.1, they are 1.940608 and 1.962171,
respectively, against target 2. Analytic Gaussian-bump contours are
exact concentric circles. All 21 notebook code cells completed, and 85 package/example
checks passed locally. The training core is unchanged. Numeric results and data hashes
are recorded in provenance/syntheticdata_gaussian_validation.json in the COATI repository.
Earlier analytic-map results remain in provenance/gaussian_sync_validation.json.
BranchSync
The BranchSync tutorial regenerates the five paired ToySplit snapshots from the original seed-42 recipe. Each stage contains 400 paired two-dimensional cells. The generated primary and secondary arrays match the Figure 2b source NPZ arrays exactly. Spatial x-coordinate bins cover [0, 1], while the balanced model retains the separate historical training-time grid 0, 1, 2, 3, 4.
The notebook refits the original raw-coordinate FiLM map rather than loading the legacy checkpoint. It preserves width 64, three layers, time width 32, the 300-epoch budget, batch size 256, paired 80/20 per-stage split, AdamW settings and time-balanced raw MSE. No feature or time standardization is applied. Every fifth epoch is evaluated by the sum of the five validation Sinkhorn divergences, matching the historical checkpoint rule. The selected epoch is 295. Held-out paired RMSE across the five stages is 0.002397, 0.016145, 0.017249, 0.023427 and 0.027798.
Both balanced vector fields use 10,000 iterations, width 256, two LeakyReLU layers, batch size 128, learning rate 1e-3, kinetic-energy coefficient 0.1 and primary matching coefficient 10. BranchSync uses Cy=0.9 and secondary manifold coefficient 100; the primary-only control uses manifold coefficient 1. Both start from identical weights. The primary adaptive matching coefficient starts and is capped at 10, while the BranchSync secondary coefficient starts and is capped at 100. At iteration 10,000, BranchSync’s weighted primary and secondary PDF-to-primary-energy gradient ratios are 4.70 and 130.83, respectively; its density-to-primary-energy gradient ratio is 378.22. The requested secondary constraints therefore dominate the final gradient diagnostic.
Model |
Primary terminal separation |
Mapped terminal separation |
Secondary endpoint Sinkhorn |
Primary endpoint Sinkhorn |
|---|---|---|---|---|
Primary only |
0.093899 |
0.267969 |
0.000615 |
0.000419 |
BranchSync |
0.094217 |
0.269675 |
0.000302 |
0.000251 |
Separation is distributional: at the terminal time, the upper and lower halves are
defined by the current y-coordinate median. No per-cell lineage identity is assumed.
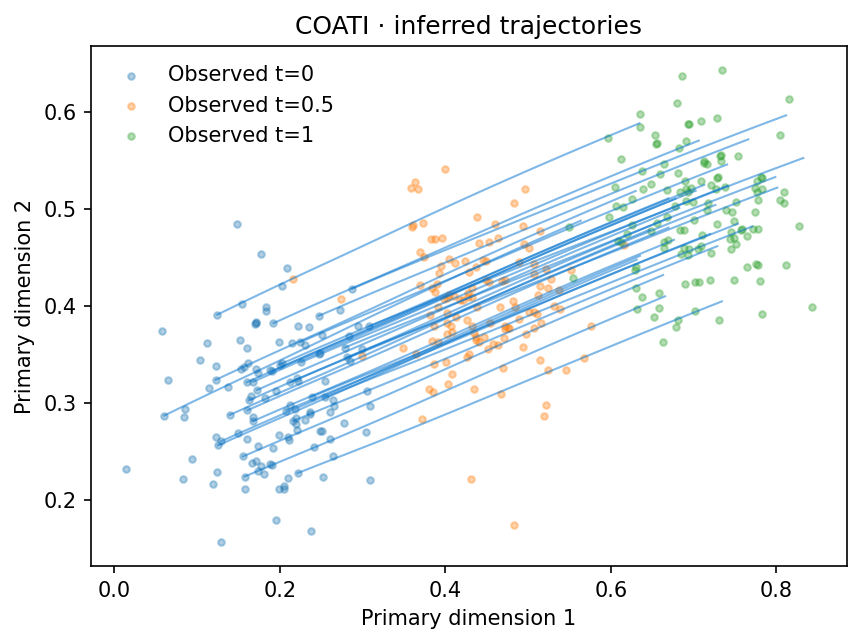
The comparison plot shows individual trajectories in one color without an average path.
Full settings and source hashes are recorded in
provenance/branch_sync_validation.json.
Mouse gastrulation quickstart
The Mouse gastrulation tutorial contains the minimal data preparation, training and UMAP workflow. All nine cells were executed on 35,503 paired cells at four observed times, using RNA50 and ATAC14 in their supplied normalized representation. The cross-modal map passed its internal validation, followed by 1,000 vector-field training iterations.
One UMAP shows observed E8.5 cell types and the projected COATI flow. The Python
script was checked by reloading the saved result and reproducing the view.
Pairing, model inputs, source-file hashes and finite nonzero velocities were
verified. The training core and original project are unchanged. This short run
is a workflow demonstration; it does not establish biological accuracy.
Settings and validation details are in provenance/gastrulation_quickstart.json.
Original Gaussian reference reproduction
The original Gaussian experiment loads byte-identical copies of the original primary/secondary observations, support cloud, frozen Fourier-map checkpoint and reference vector-field artifacts. All source hashes were checked; original TraInf files are unchanged. No endpoint sampling, normalization, warm-up or analytic-map substitution is used.
The original checkpoint replay has zero maximum primary-coordinate error and
approximately 1.2e-7 secondary-coordinate error against the saved tensors in this
environment. A separate direct 3,000-step fit was executed and displayed. It does
not recover the historical weights exactly; refitting and checkpoint replay are
explicitly distinguished. All 79 package tests passed, including data identity
and original-checkpoint replay checks. Full comparisons and measured errors are
in provenance/gaussian_reference_comparison.md and
provenance/gaussian_reference_validation.json.