Mouse gastrulation
Load paired RNA and ATAC observations, train COATI, and show the learned flow on a UMAP. This short example uses all four observed stages. The default settings are shared with the Python script.
from pathlib import Path
import os
import json
import uuid
import anndata as ad
import numpy as np
import matplotlib.pyplot as plt
import coati as ct

%matplotlib inline
plt.rcParams.update({"font.family": "Arial", "font.size": 11})
project_dir = next(p for p in (Path.cwd(), *Path.cwd().parents)
                   if (p / "pyproject.toml").exists() and (p / "src/coati").is_dir())
data_dir = Path(os.environ.get(
    "COATI_GASTRULATION_DATA", project_dir.parent / "TraInfBench/data/processed/gastrulation",
))
settings = json.loads((project_dir / "examples/gastrulation/config.json").read_text())
Load the data
Use the prepared rna.h5ad and atac.h5ad files from the gastrulation dataset. Set COATI_GASTRULATION_DATA if they are stored elsewhere.
RNA PCA and ATAC LSI features in X_latent are already normalized. Use these features for training and the supplied X_umap for display. prepare_anndata standardizes metadata to celltype, time and barcode on a working copy; unannotated cells remain unknown.
rna = ad.read_h5ad(data_dir / "rna.h5ad")
atac = ad.read_h5ad(data_dir / "atac.h5ad")
assert rna.obs_names.is_unique and rna.obs_names.equals(atac.obs_names)
np.testing.assert_array_equal(rna.obs["time_point_processed"], atac.obs["time_point_processed"])
np.testing.assert_array_equal(rna.obs["stage"], atac.obs["stage"])
cells = ct.prepare_anndata(
    rna, use_rep="X_latent", time_key="time_point_processed",
    celltype=rna.obs["celltype"].astype(object).fillna("unknown"),
    secondary=atac.obsm["X_latent"], secondary_key="X_atac", warn=False,
)
cells.obs.groupby(["stage", "time"], observed=True).size().rename("Cells").to_frame()
| Cells | ||
|---|---|---|
| stage | time | |
| E7.5 | 0.0 | 9018 |
| E8.0 | 1.0 | 7796 |
| E8.5 | 2.0 | 11470 |
| E8.75 | 2.5 | 7219 |
Train COATI
This example uses paired modalities and allows changing population mass. COATI fits the cross-modal map and then the primary vector field. Defaults are stored in the example configuration.
config = ct.Config(**settings["training"])
run_dir = project_dir / "outputs" / ("gastrulation-" + uuid.uuid4().hex[:8])
result = ct.train_vector_field(cells, config, output_dir=run_dir)
print("Model:", result.output_dir.relative_to(project_dir))
print("Observed times:", result.data.times)
Model: outputs/gastrulation-5f62a4f1
Observed times: [0.  1.  2.  2.5]
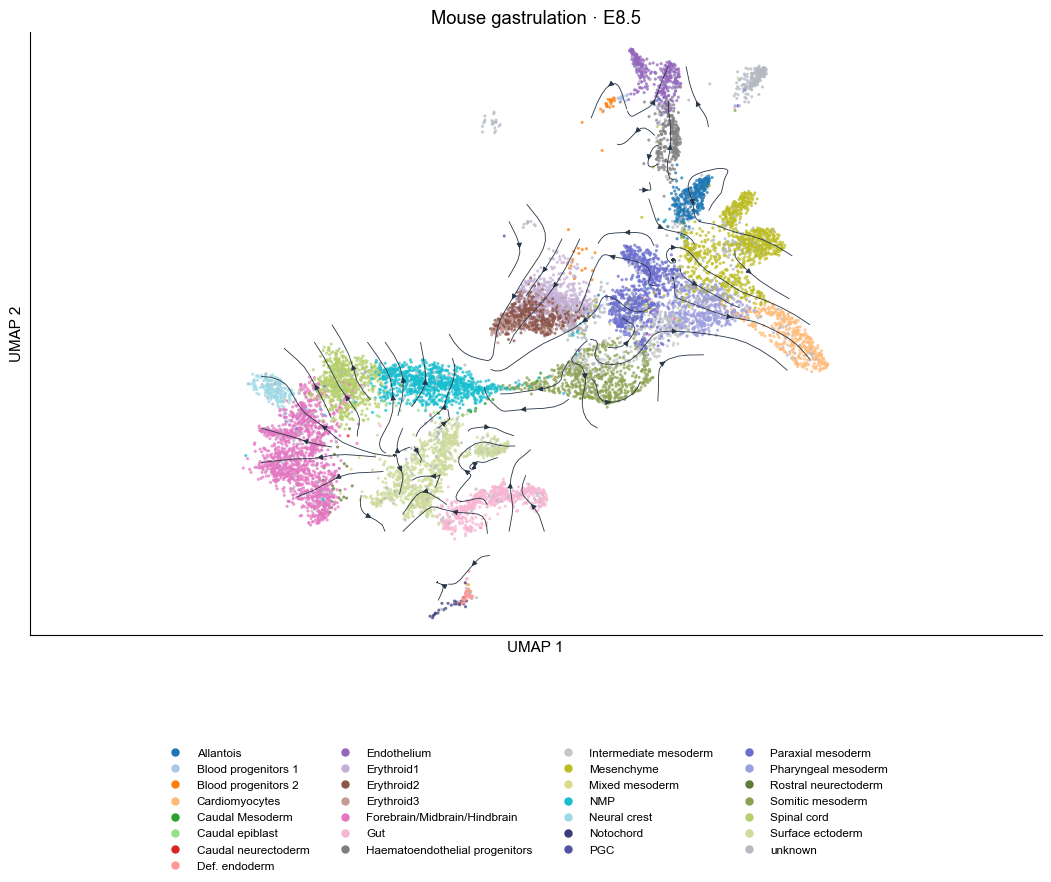
Show the UMAP flow
Colors show the supplied cell types at the selected stage. Lines show the learned COATI velocities projected onto the existing RNA UMAP.
stage = settings["plot_stage"]
stage_cells = cells[cells.obs["stage"] == stage].copy()
colors = list(plt.get_cmap("tab20").colors) + list(plt.get_cmap("tab20b").colors)
palette = dict(zip(stage_cells.obs["celltype"].cat.categories, colors))
palette["unknown"] = "#b5bac2"
fig, ax = plt.subplots(figsize=(11, 9))
result.plot_velocity(
    stage_cells, color="celltype", style="stream", palette=palette,
    point_size=5, alpha=.75, density=1.2, linewidth=.6, arrow_size=.8, ax=ax,
    title=f"Mouse gastrulation · {stage}",
)
legend = ax.get_legend()
fig.legend(legend.legend_handles, [t.get_text() for t in legend.get_texts()],
           loc="lower center", ncol=4, frameon=False, fontsize=8.5, markerscale=1.2)
legend.remove()
ax.set_xticks([])
ax.set_yticks([])
fig.subplots_adjust(left=.06, right=.98, bottom=.27, top=.94)
plt.show()
The same workflow is available as a Python script:
python -m examples.gastrulation.train_film --output outputs/gastrulation-film/T_FiLM.pt
python -m examples.gastrulation.train_balanced --map-checkpoint outputs/gastrulation-film/T_FiLM.pt
This short run demonstrates data preparation, training and visualization.