Unbalanced Gaussian bump
Repeat the Gaussian-bump comparison with population growth. The data and frozen map are identical to the balanced tutorial. The terminal population mass is explicitly set to twice the initial mass. Compare beta = 1 and beta = 0.1, with and without synchronization, and show instantaneous growth along every learned trajectory.
from pathlib import Path
import sys
import uuid

example_dir = next(parent / "examples" for parent in (Path.cwd(), *Path.cwd().parents)
                   if (parent / "examples" / "synthetic" / "gaussian_assets.py").is_file())
if str(example_dir) not in sys.path:
    sys.path.insert(0, str(example_dir))

import anndata as ad
import numpy as np
import pandas as pd
import torch
import matplotlib.pyplot as plt
import coati as ct
from synthetic.gaussian_map import evaluate_bump_map, plot_map_performance
from synthetic.gaussian_comparison import (
    make_shared_initial_checkpoint,
    plot_gaussian_sync,
    plot_bump_height,
    compare_gaussian_runs,
)
from synthetic.gaussian_assets import load_shared_gaussian_assets, resolve_asset_directory

%matplotlib inline
torch.set_num_threads(1)
plt.rcParams.update({"font.family": "Arial", "font.size": 11})
run_dir = Path("outputs") / ("gaussian-bump-" + uuid.uuid4().hex[:8])
run_dir.mkdir(parents=True)
print("Result directory:", run_dir)

from synthetic.gaussian_assets import plot_growth_along_trajectories
Result directory: outputs/gaussian-bump-89dd1efe
Inspect the frozen map
map_scores, map_grid = evaluate_bump_map(T, map_pairs, grid_n=96)
display(map_scores.round(6))
plot_map_performance(map_grid)
plt.show()
print(f"Best validation step: {map_payload['fit']['best_step']}")
print(f"Grid z correlation: {map_grid['z_correlation']:.6f}")
print(f"Learned height at (0.5, 0.5): {map_grid['center_predicted_height']:.6f}")
| Pairs | XY_RMSE | Z_RMSE | Z_MAE | |
|---|---|---|---|---|
| Evaluation | ||||
| Held-out observed | 434 | 0.000047 | 0.021079 | 0.004067 |
| Held-out support | 1066 | 0.000065 | 0.005544 | 0.003500 |
| Independent grid | 9216 | 0.000067 | 0.005036 | 0.002998 |
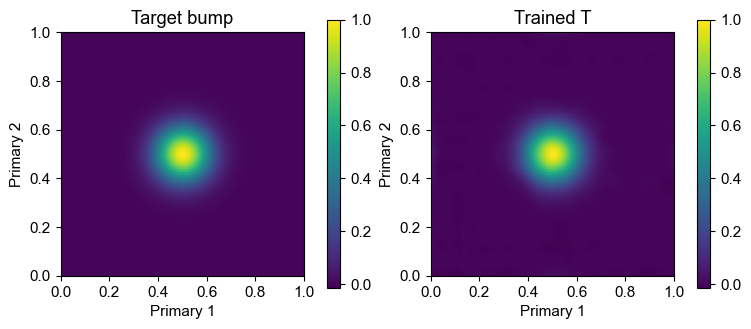
Best validation step: 1500
Grid z correlation: 0.999378
Learned height at (0.5, 0.5): 0.999919
Configure unbalanced transport
balanced=False enables the growth field and mass-matching loss. biological_num=[1, 2]
is the relative population-mass prior, so the target terminal mass is 2. The observed sample
counts imply the same ratio, but writing the prior explicitly makes the intended experiment
independent of future resampling. mass_weight=100 and global_mass=True enforce both local
allocation and total population mass. In the implementation, beta is growth_weight, the
alpha_growth coefficient multiplying the learned growth rate and growth action.
base_config = ct.Config(
    multimodal=True,
    balanced=False,
    iterations=3000,
    batch_size=256,
    hidden_dim=256,
    secondary_weight=.5,
    growth_weight=1.,
    mass_weight=100.,
    global_mass=True,
    extra={
        "biological_num": [1.0, 2.0],
        "median_n_sample": 512,
        "floor_n_sample": 256,
        "adaptive_lambda": True,
    },
)
configs = {}
for beta in [1.0, .1]:
    beta_config = base_config.with_parameters(growth_weight=beta)
    configs[f"beta={beta:g} | Without sync"] = beta_config.with_parameters(
        multimodal=False, secondary_weight=0.
    )
    configs[f"beta={beta:g} | With sync"] = beta_config

pd.DataFrame({name: {key: cfg.to_dict()[key] for key in
    ["niters", "num_samples", "sync_loss", "sync_weight", "unbalancedModel",
     "alpha_growth", "mass_loss", "mass_coefficient", "global_mass", "biological_num"]}
    for name, cfg in configs.items()})
| beta=1 | Without sync | beta=1 | With sync | beta=0.1 | Without sync | beta=0.1 | With sync | |
|---|---|---|---|---|
| niters | 3000 | 3000 | 3000 | 3000 |
| num_samples | 256 | 256 | 256 | 256 |
| sync_loss | False | True | False | True |
| sync_weight | 0.0 | 0.5 | 0.0 | 0.5 |
| unbalancedModel | True | True | True | True |
| alpha_growth | 1.0 | 1.0 | 0.1 | 0.1 |
| mass_loss | True | True | True | True |
| mass_coefficient | 100.0 | 100.0 | 100.0 | 100.0 |
| global_mass | True | True | True | True |
| biological_num | [1.0, 2.0] | [1.0, 2.0] | [1.0, 2.0] | [1.0, 2.0] |
Train the vector and growth fields
All four runs start from identical unbalanced network weights. Each model contains a velocity field and an instantaneous log-growth field; only beta and synchronization differ.
initial = make_shared_initial_checkpoint(base_config, run_dir / "initial.pt")
results = {}
for name, cfg in configs.items():
    print("Training:", name, flush=True)
    slug = name.lower().replace(" | ", "-").replace("=", "").replace(".", "p").replace(" ", "-")
    results[name] = ct.train_vector_field(
        cells, cfg, use_rep="X_latent", secondary_obsm_key="X_secondary",
        T_model=T if cfg.multimodal else None,
        output_dir=run_dir / slug,
        warm_start_path=initial,
    )
Training: beta=1 | Without sync
Training: beta=1 | With sync
Training: beta=0.1 | Without sync
Training: beta=0.1 | With sync
Learned trajectories
predictions = {}
for name, result in results.items():
    prediction = result.predict_trajectory(times=np.linspace(0., 1., 51), method="rk4")
    with torch.no_grad():
        prediction["secondary"] = T(torch.as_tensor(prediction["primary"], dtype=torch.float32)).numpy()
    predictions[name] = prediction

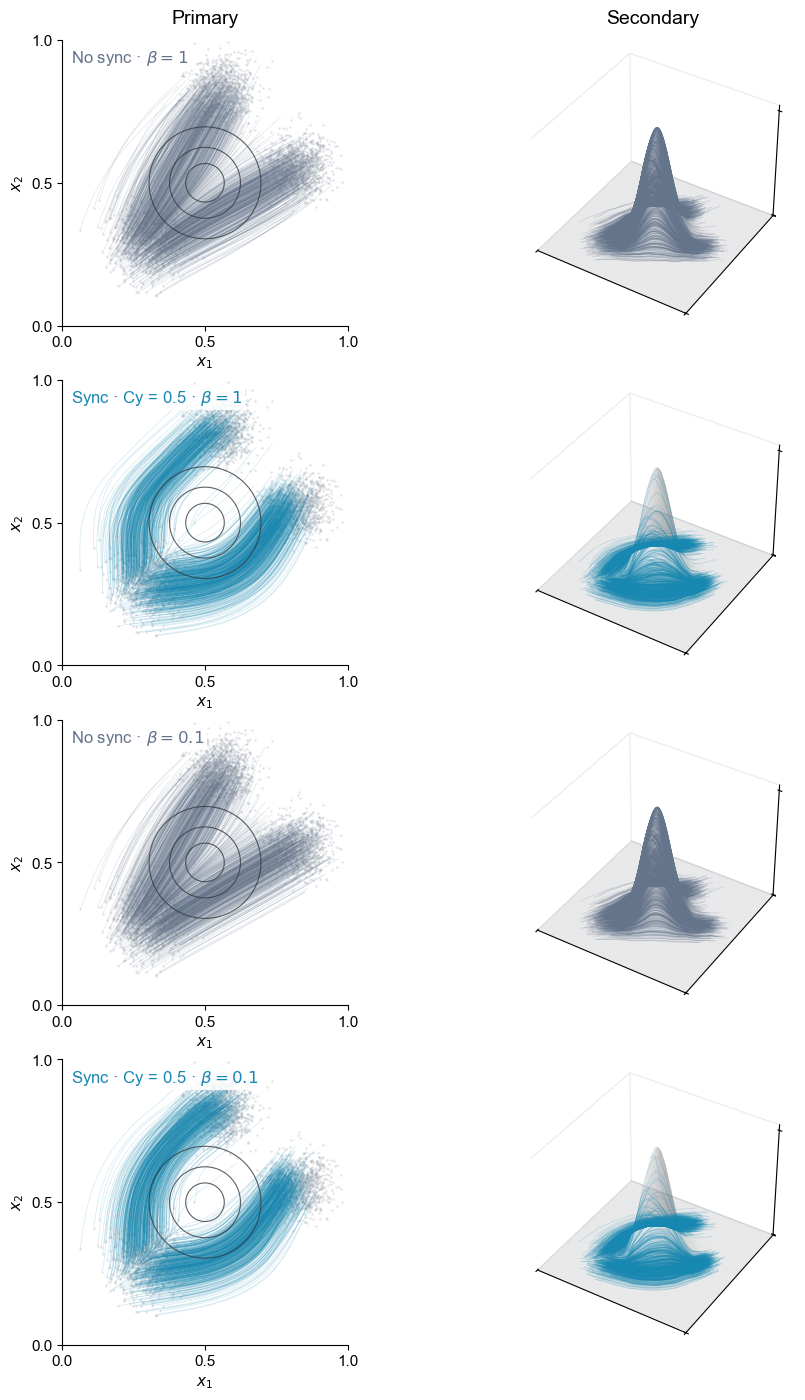
plot_gaussian_sync(data, T, results, predictions)
plt.show()
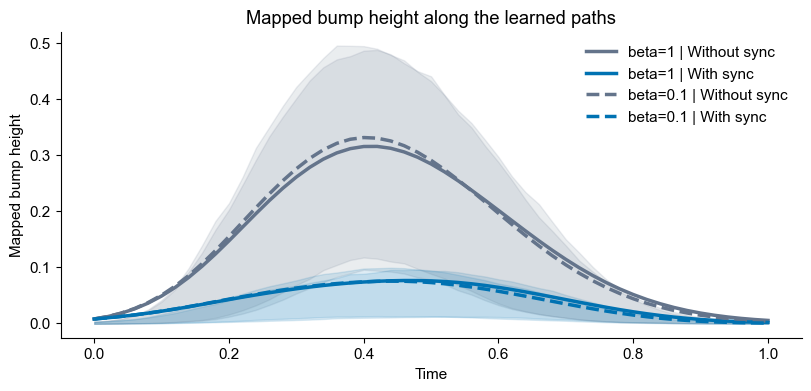
plot_bump_height(predictions)
plt.show()
Growth along trajectories
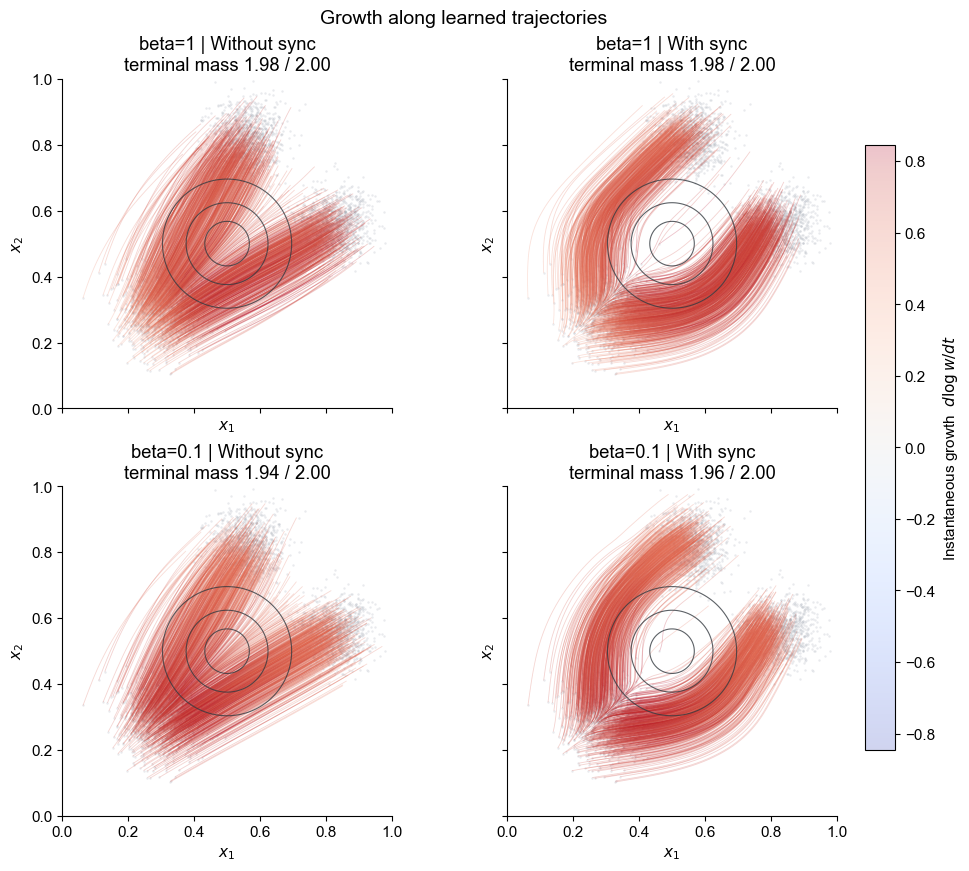
Blue segments indicate negative instantaneous growth and red segments indicate positive instantaneous growth. The colour is the fitted \(d\log w/dt\) evaluated along each path; the title reports the integrated terminal mass against the target of 2. Because both terminal populations expand in this example, the learned raw growth may remain positive and therefore use mainly the red half of the diverging scale.
growth_figure, growth = plot_growth_along_trajectories(data, results, predictions)
plt.show()
Mass and transport diagnostics
scores = compare_gaussian_runs(results, predictions)
display(scores.T.round(6))
pd.DataFrame({name: result.evaluate() for name, result in results.items()}).T.round(6)
| Model | beta=1 | Without sync | beta=1 | With sync | beta=0.1 | Without sync | beta=0.1 | With sync |
|---|---|---|---|---|
| Primary endpoint Sinkhorn | 0.000653 | 0.001105 | 0.000491 | 0.000484 |
| Primary kinetic energy | 0.200886 | 0.241582 | 0.209753 | 0.260358 |
| Secondary kinetic energy | 1.372201 | 0.322865 | 1.362476 | 0.328599 |
| Predicted terminal mass | 1.980399 | 1.981807 | 1.940608 | 1.962171 |
| Target terminal mass | 2.000000 | 2.000000 | 2.000000 | 2.000000 |
| Median maximum bump height | 0.380701 | 0.043216 | 0.380506 | 0.045225 |
| States outside unit square | 0.000000 | 0.000000 | 0.000000 | 0.000000 |
| endpoint_sinkhorn_before | endpoint_sinkhorn_after | kinetic_energy_mean | endpoint_sampling_floor | predicted_mass_ratio | observed_count_ratio | secondary_endpoint_sinkhorn | |
|---|---|---|---|---|---|---|---|
| beta=1 | Without sync | 0.165117 | 0.000780 | 0.000201 | 0.000348 | 1.980400 | 2.0 | NaN |
| beta=1 | With sync | 0.165117 | 0.000917 | 0.000242 | 0.000348 | 1.981807 | 2.0 | 0.000928 |
| beta=0.1 | Without sync | 0.165117 | 0.000521 | 0.000210 | 0.000348 | 1.940608 | 2.0 | NaN |
| beta=0.1 | With sync | 0.165117 | 0.000482 | 0.000260 | 0.000348 | 1.962171 | 2.0 | 0.000488 |